Raptor Maps
Pros
- Industry-leading digital twin and thermal inspection capabilities.
- AI-driven analytics accelerate fault identification and prioritization.
- Offline-capable mobile app supports remote field operations.
- Highly scalable for utility-scale renewable portfolios.
- Supports full lifecycle workflows from construction to operations.
- Strong security standards including SOC 2 compliance.
Cons
- No transparent public pricing.
- Requires access to quality aerial imagery and drone infrastructure.
- Advanced autonomous inspection systems increase implementation complexity.
- Teams unfamiliar with drone workflows may require training.
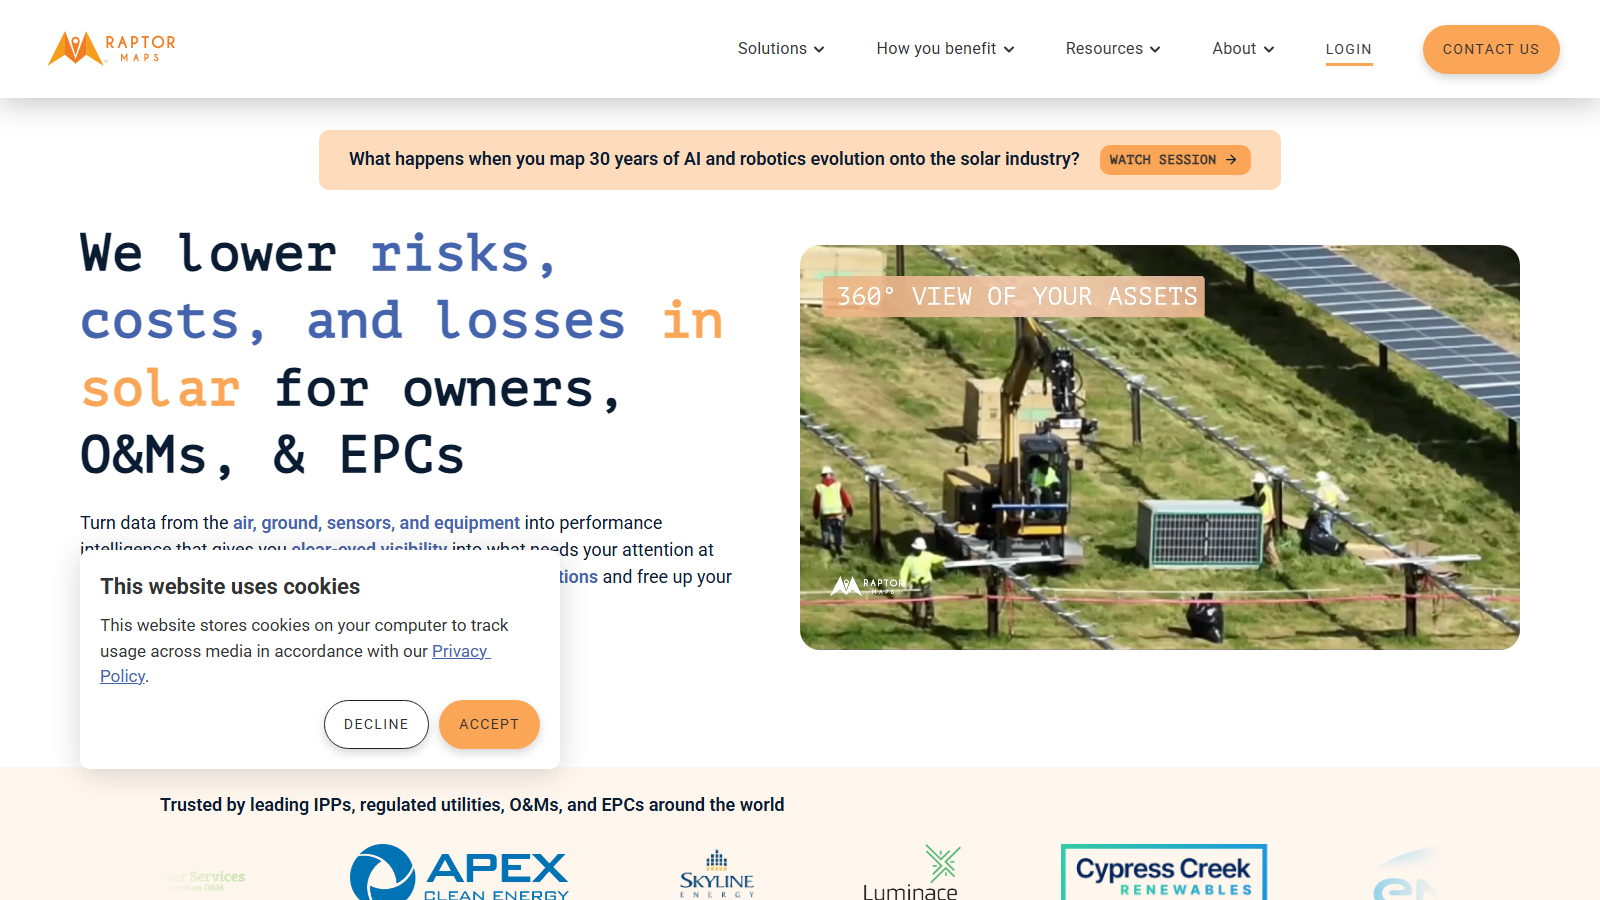
Managing large-scale solar portfolios often means dealing with fragmented operational data, manual inspections, and delayed fault detection. Asset owners and operations teams need faster ways to identify underperforming equipment and prioritize maintenance before production losses grow. Raptor Maps addresses these challenges through a centralized Solar Lifecycle Management platform powered by AI-driven analytics and geospatial digital twins.
By combining aerial thermal imagery, SCADA data, and field operations into one platform, Raptor Maps helps utility-scale solar operators move from reactive maintenance toward predictive, data-driven asset management. The result is improved uptime, more efficient field operations, and better long-term energy production performance.
What Is Raptor Maps?
Raptor Maps is a Solar Lifecycle Management (SLM) platform designed for utility-scale and commercial solar asset management.
The platform creates geospatial digital twins of solar facilities by integrating drone imagery, thermal inspections, SCADA systems, and maintenance records into a centralized operational environment used by developers, independent power producers (IPPs), EPCs, and O&M providers.
Features
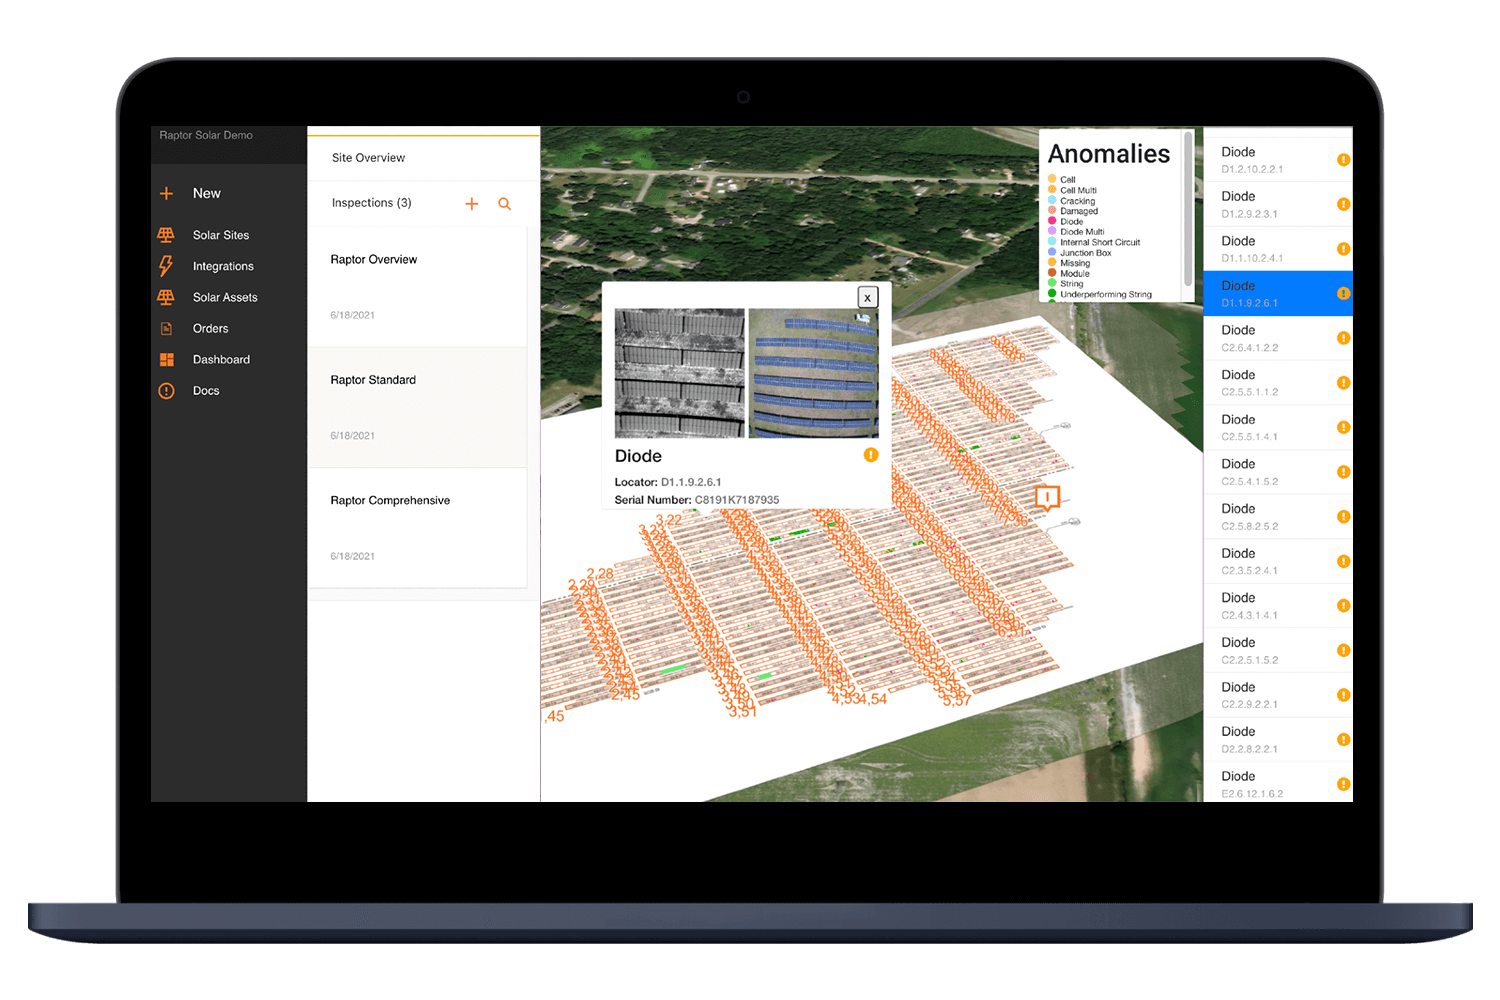
- Geospatial Digital Twin: Maintain a GPS-accurate digital record of solar equipment, inspections, and historical maintenance.
- Aerial Thermal Inspections: Use AI-powered thermal analytics to identify module, string, and combiner-level defects.
- Production Analytics: Normalize SCADA and DAS data to analyze real operational performance.
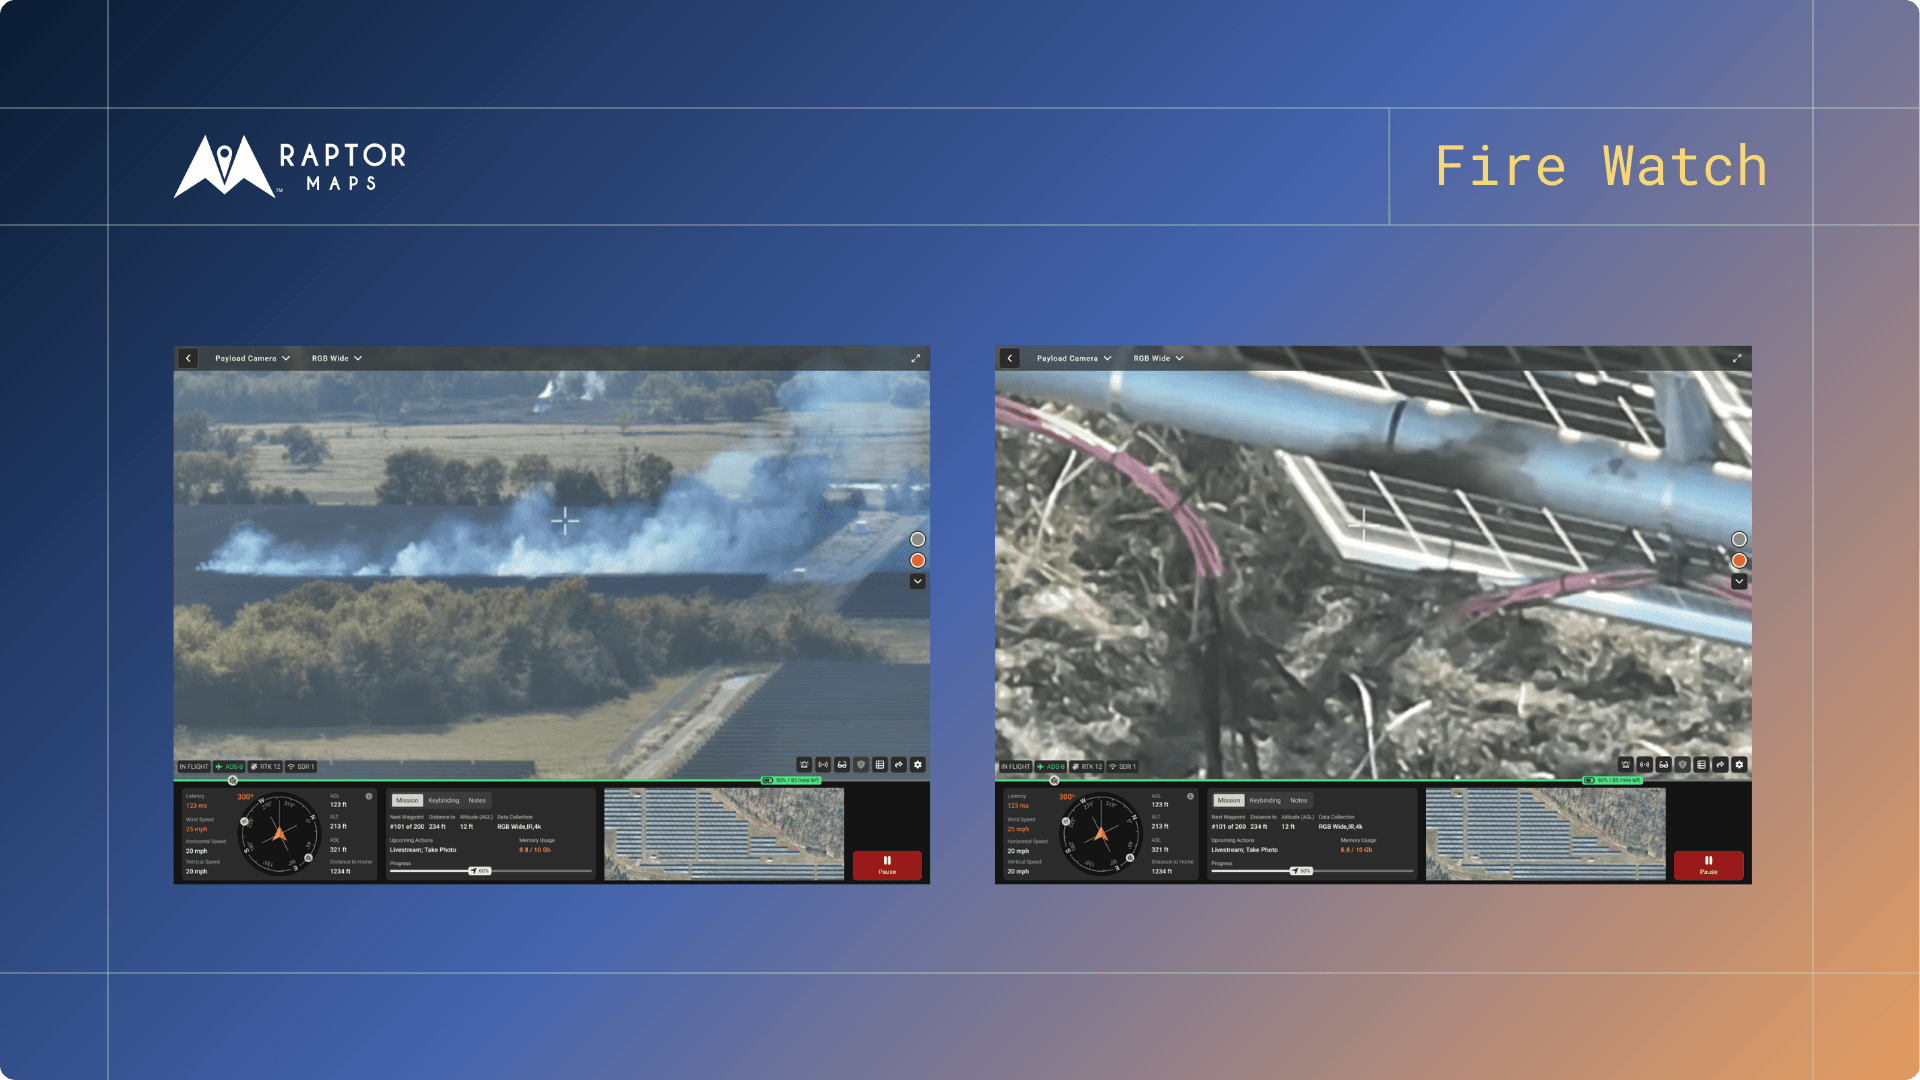
- Raptor Solar Sentry: Autonomous drone-in-a-box solution for scheduled and event-driven inspections.
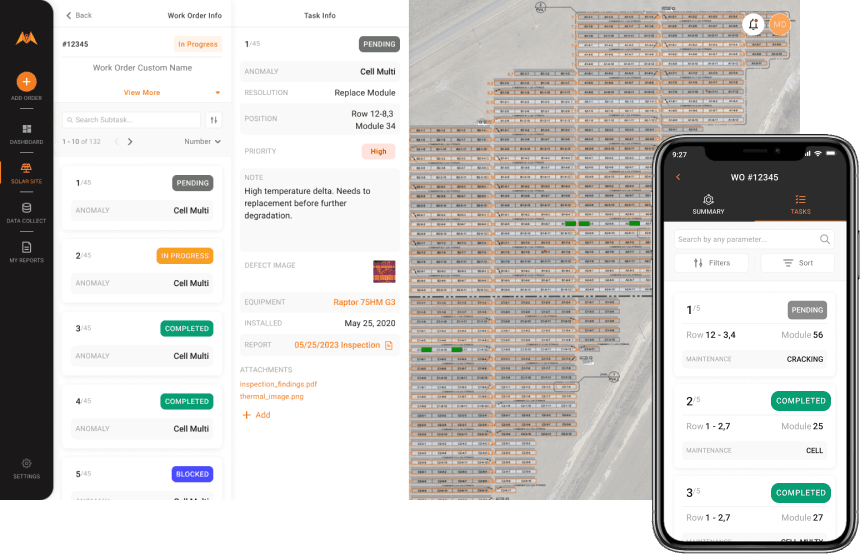
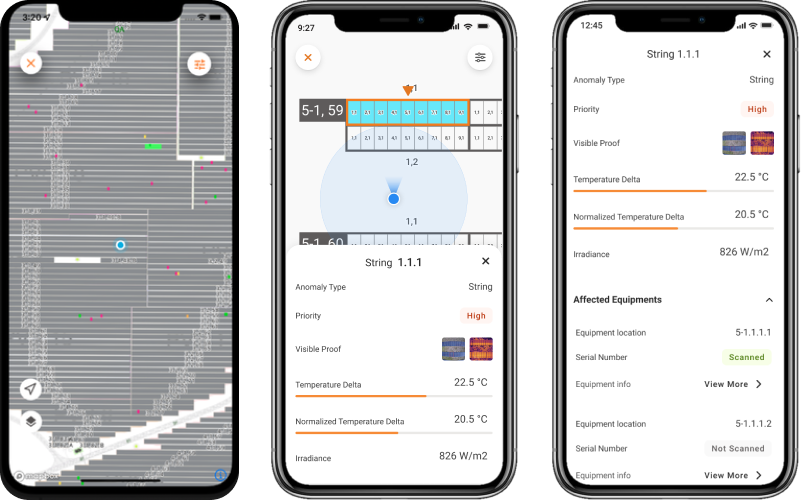
- Mobile Technician App: Offline-capable field application for inspections and repair workflows.
- Warranty Claims Management: Organize defect documentation and serial number tracking.
- Construction Progress Monitoring: Generate 3D and 4D site analytics during project construction.
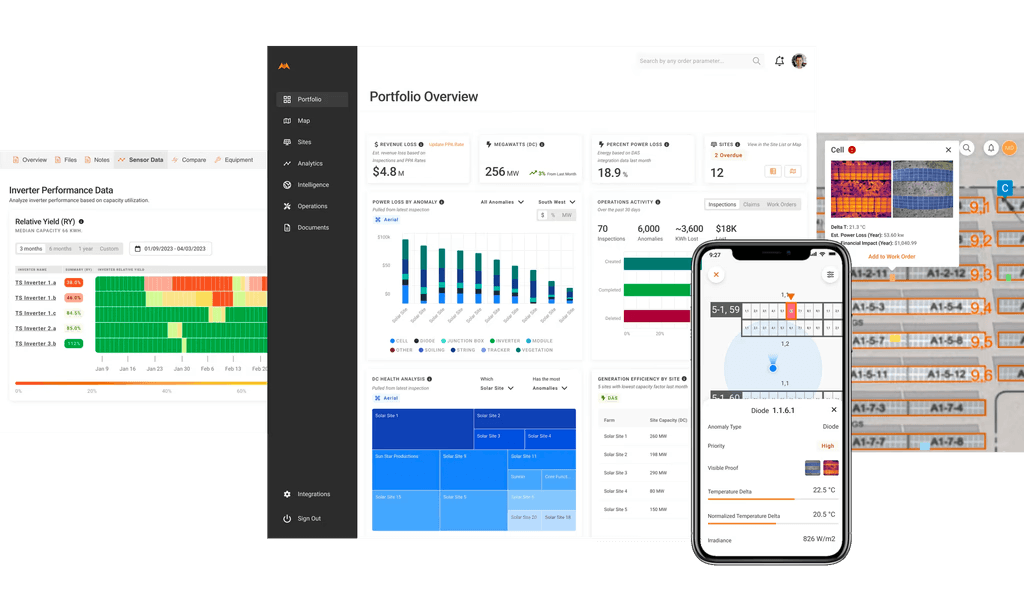
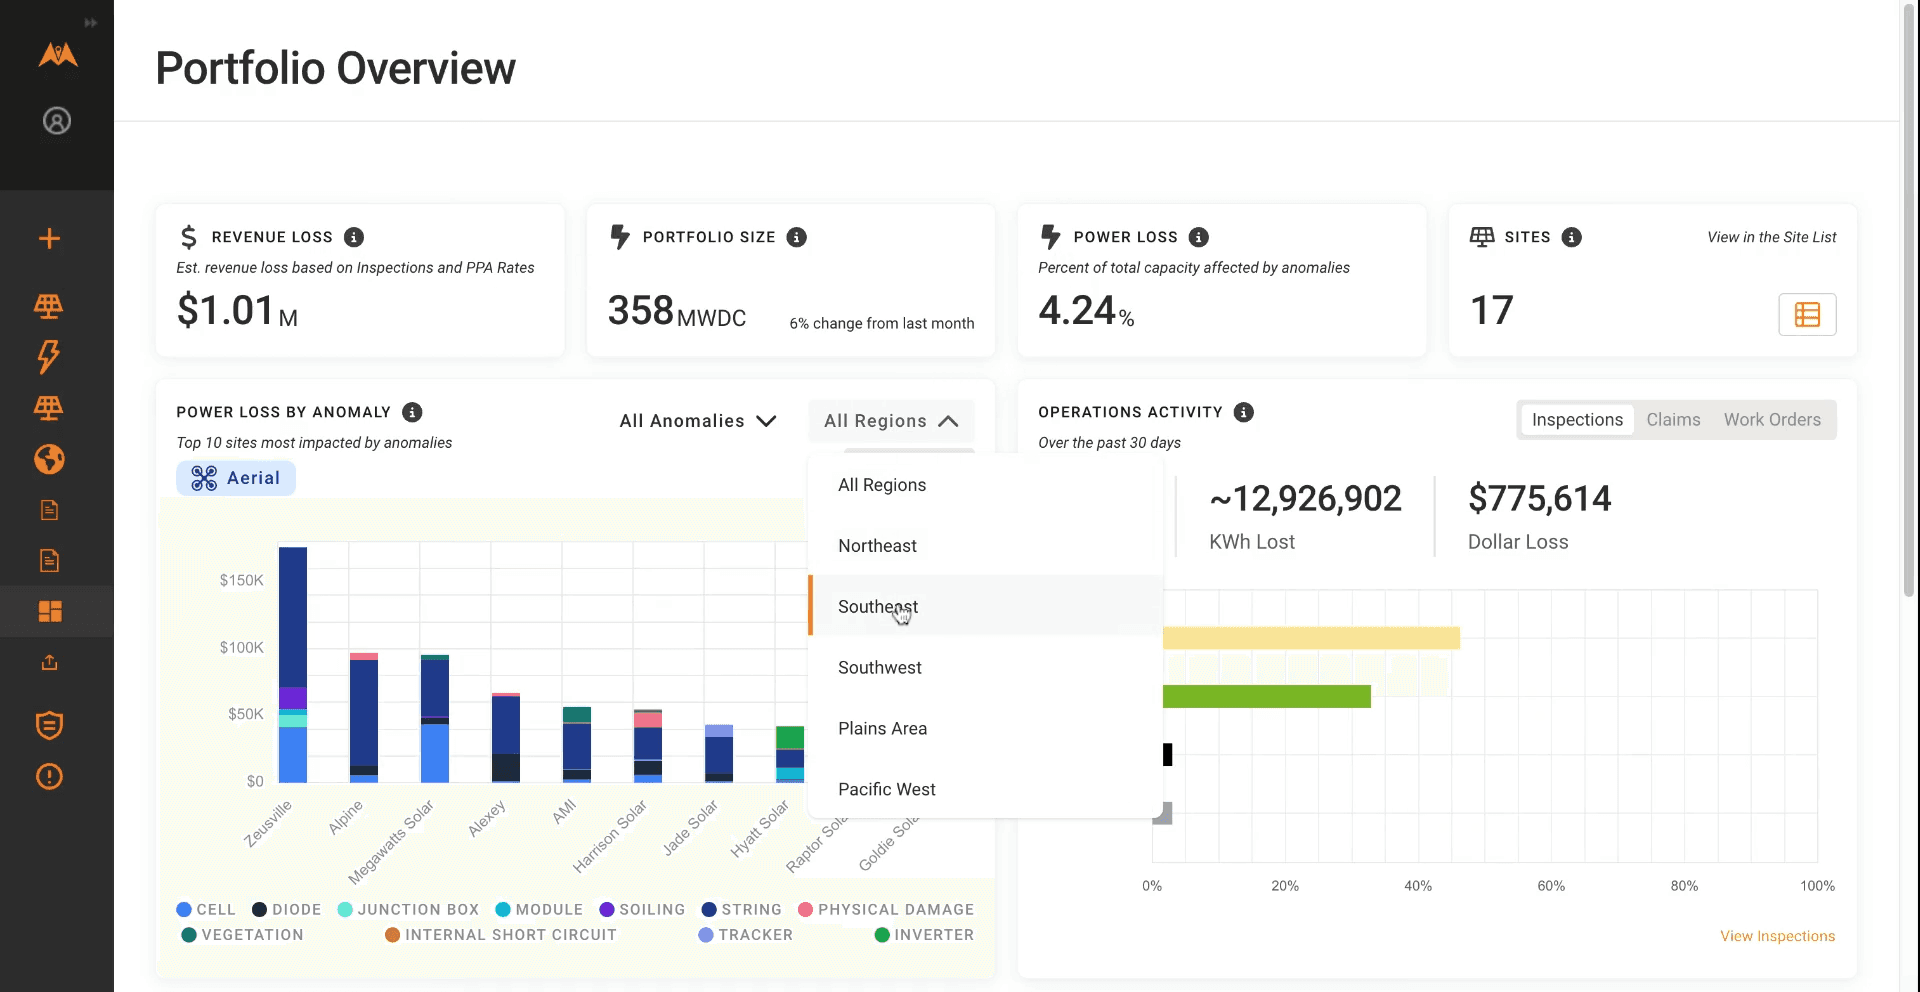
Screenshots
Raptor Maps Pricing
Raptor Maps uses a custom enterprise pricing model based on portfolio size, software modules, and hardware requirements.
- Custom Quotes: Pricing depends on site count, capacity, and selected platform features.
- Demo Access: Organizations can request demonstrations and consultations.
- Optional Hardware Services: Drone docking systems and aerial inspection services may require additional fees.
- No Public Pricing: Subscription pricing is not listed publicly.
Integrations
Raptor Maps supports integration with renewable energy hardware, monitoring systems, and analytics platforms.
- SCADA and DAS Systems: Connect operational solar production data.
- Drone Hardware: Compatible with DJI, Skydio, and thermal imaging systems.
- APIs and Webhooks: Integrate inspection data with internal maintenance systems.
- Satellite and Sensor Data: Combine aerial imagery with environmental monitoring inputs.
- Third-Party Analytics: Integrations with inspection and tracker analytics tools.
How to Set Up Raptor Maps
- Book a consultation and portfolio assessment with the Raptor Maps team.
- Select required software modules and drone inspection workflows.
- Upload site drawings and historical operational data.
- Integrate SCADA systems and monitoring infrastructure.
- Train field and operations teams on desktop and mobile workflows.
- Perform initial inspections to establish baseline asset performance.
How to Use Raptor Maps
Asset managers typically begin by reviewing the portfolio dashboard to identify active alerts and underperforming sites. AI-generated insights inside the digital twin help pinpoint specific equipment failures and production issues.
Field technicians receive assigned tasks through the mobile application, which guides them directly to the GPS location of affected modules or components. After repairs are completed, technicians upload photos and notes that automatically synchronize back to the centralized digital twin.
What You Can Manage with Raptor Maps
- Digital Twin Records: Maintain equipment histories and inspection archives.
- Inspection Workflows: Analyze thermal imagery and field findings.
- Maintenance Operations: Prioritize and track repairs across sites.
- Performance Analytics: Monitor normalized production and equipment KPIs.
- Warranty Documentation: Organize defect records and manufacturer claims.
- Environmental Monitoring: Track vegetation growth and site conditions.
FAQs
What does Raptor Maps do?
Raptor Maps uses AI, aerial imagery, and digital twin technology to help solar operators monitor asset performance, identify equipment failures, and manage maintenance workflows.
Who is Raptor Maps best for?
It is designed for utility-scale solar asset owners, developers, EPCs, and O&M providers managing large or geographically distributed solar portfolios.
Is Raptor Maps free?
No, Raptor Maps is a premium enterprise SaaS platform that requires custom subscription pricing.
What are the main limitations of Raptor Maps?
Main limitations include the need for high-quality aerial data, onboarding complexity for drone-based operations, and the lack of transparent public pricing.
What are the best alternatives to Raptor Maps?
Popular alternatives include Schneider Electric EcoStruxure, Siemens MindSphere, Scanifly, and AI Clearing for construction and aerial inspection workflows.